Today, the Commission is publishing preliminary figures on road fatalities for 2023. Around 20,400 people were killed in road crashes in the EU last year, a small 1% decrease on 2022. Despite some progress since the baseline year of 20191, few Member States are on track to meet the target of halving the number of road deaths by 2030.
Contrasting picture across Member States
EU-wide, road deaths in 2023 fell by 1% on the previous year. While this represents around 2,360 fewer fatalities (-10%) compared with 2019, the downward trend has flatlined in several Member States.
Since 2019, the number of road deaths has scarcely fallen in Spain, France and Italy, while it has risen in Ireland, Latvia, the Netherlands, Slovakia and Sweden. In contrast, over the last four years, Belgium, Czechia, Denmark, Hungary and Poland2 are on track to meet the 50% reduction target in road deaths and serious injuries by 2030 (It is important to note that this is based on preliminary and often partial data).
The overall ranking of countries’ fatality rates has not changed significantly, with the safest roads still found in Sweden (22 deaths per one million inhabitants) and Denmark (27/million). Bulgaria (82/million) and Romania (81/million) reported the highest fatality rates in 2023. The EU average was 46 road deaths per million inhabitants.
Most affected groups
The available EU-wide data for 2022 (detailed 2023 data is not yet available) shows that 52% of road traffic fatalities occurred on rural roads, versus 38% in urban areas and 9% on motorways.
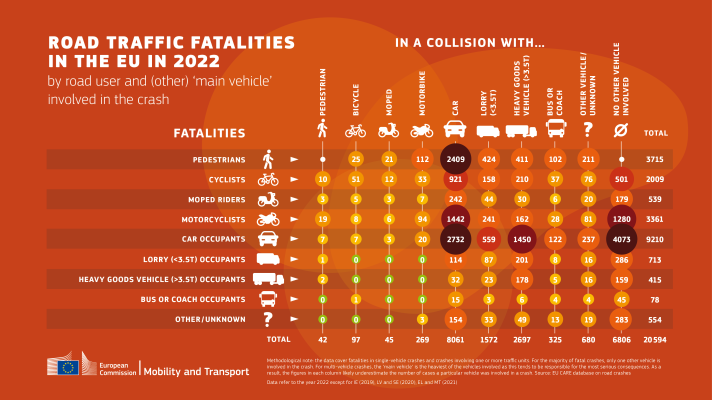
The trend in the number of cyclists killed on EU roads is a serious concern: more than 2,000 cyclists were killed in 2022. This is the only main road user group not to see a significant drop in fatalities over the last decade, notably due to a persistent lack of appropriate infrastructure and unsafe behaviour of all road users such as speeding, distraction and driving under the influence of alcohol and drugs.
Men accounted for three out of four road deaths (77%). Older people, aged 65+, are at greater risk as they represented 29% of all road deaths while they account for 21% of the population. Similarly, young people aged 18-24 accounted for 12% of road deaths but 7% of the population.
Car occupants (drivers and passengers) represented 45% of all fatalities, while pedestrians accounted for 18%, users of powered two-wheelers (motorbikes and mopeds) 19%, and cyclists 10%. The patterns change significantly depending on age. Among those aged 65+, pedestrians represent 29% of fatalities and cyclists 17%. See below the latest collision matrix detailing the main vehicles involved in fatal road crashes.
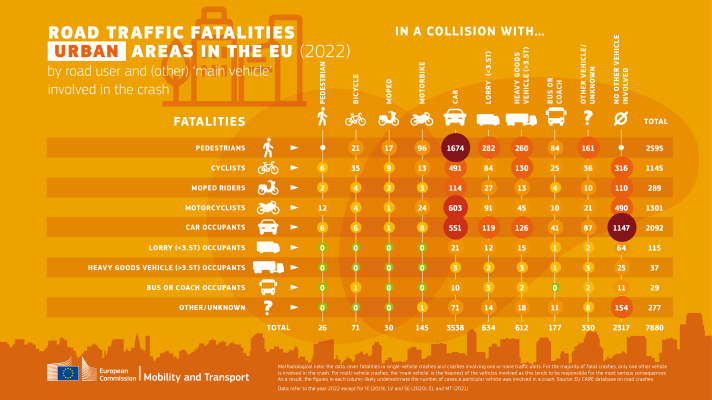
Within urban areas, vulnerable road users (pedestrians, cyclists and users of powered two-wheelers) represent almost 70% of total fatalities. Urban road user fatalities occur overwhelmingly when a crash involves cars and lorries, underlining the need to improve protection of these vulnerable road users. See below the latest collision matrix for urban roads.
Background
In 2018, the EU set itself a 50% reduction target for road deaths – and, for the first time, also serious injuries – by 2030. This was set out in the Commission's Strategic Action Plan on Road Safety and EU road safety policy framework 2021-2030, which also laid out road safety plans aiming to reach zero road deaths by 2050 (‘Vision Zero’).
In March 2023, the Commission put forward a package of proposals tackling road safety, including updated requirements for driving licences and better cross-border enforcement of road traffic rules.
Road safety has also been a core element of recent EU mobility policy initiatives, including the Sustainable and Smart Mobility Strategy, the new TEN-T regulation and the Urban Mobility Framework. In its proposal for a European Declaration on Cycling, the Commission acknowledges that safety is a prerequisite to encourage people to cycle, and is working to prepare guidance for quality requirements regarding vulnerable road users, including cyclists.
Along with today’s statistics, the European Road Safety Observatory also published a new annual statistical report and an updated series of country profiles.
For more information
Road safety statistics 2023 in more detail
1) 2019 is the baseline year for the target of 50% fewer deaths by 2030.
2) The ranking excludes countries with fewer than 100 fatalities per year
Road deaths per million inhabitants – preliminary data for 2023
|
|
Rate per million population |
|
Percentage change 2023 in relation to: |
|||
|
|
2022 |
2023 |
|
2022 |
2019 |
Average 2017-19 |
|
EU |
46 |
46 |
|
-1% |
-10% |
-12% |
|
Belgium |
46 |
43 |
|
-6% |
-22% |
-19% |
|
Bulgaria |
78 |
82 |
|
-1% |
-16% |
-18% |
|
Czechia |
50 |
46 |
|
-5% |
-19% |
-18% |
|
Denmark |
26 |
27 |
|
4% |
-20% |
-12% |
|
Germany |
33 |
34 |
|
2% |
-7% |
-11% |
|
Estonia |
37 |
43 |
|
20% |
13% |
6% |
|
Ireland |
31 |
35 |
|
19% |
31% |
29% |
|
Greece |
63 |
60 |
|
-5% |
-10% |
-12% |
|
Spain |
37 |
36 |
|
0% |
-1% |
-3% |
|
France |
50 |
48 |
|
-3% |
-2% |
-4% |
|
Croatia |
71 |
71 |
|
0% |
-8% |
-13% |
|
Italy |
54 |
52 |
|
-2% |
-2% |
-6% |
|
Cyprus |
41 |
37 |
|
-8% |
-35% |
-34% |
|
Latvia |
60 |
76 |
|
27% |
9% |
4% |
|
Lithuania |
43 |
56 |
|
33% |
-14% |
-13% |
|
Luxembourg |
56 |
39 |
|
-28% |
18% |
-6% |
|
Hungary |
55 |
49 |
|
-12% |
-22% |
-24% |
|
Malta |
50 |
26 |
|
-46% |
-13% |
-21% |
|
Netherlands |
37 |
35 |
|
-6% |
5% |
8% |
|
Austria |
41 |
43 |
|
7% |
-5% |
-4% |
|
Poland |
50 |
52 |
|
0% |
-35% |
-34% |
|
Portugal |
60 |
61 |
|
3% |
-8% |
-4% |
|
Romania |
86 |
81 |
|
-5% |
-17% |
-18% |
|
Slovenia |
40 |
39 |
|
-4% |
-20% |
-17% |
|
Slovakia |
49 |
52 |
|
5% |
4% |
4% |
|
Finland |
35 |
32 |
|
-10% |
-17% |
-23% |
|
Sweden |
22 |
22 |
|
2% |
5% |
-13% |
|
|
|
|
|
|
|
|
|
Switzerland |
28 |
22 |
|
-20% |
3% |
-11% |
|
Norway |
21 |
22 |
|
5% |
13% |
14% |
|
Iceland |
24 |
21 |
|
-11% |
33% |
-40% |
Source: EU CARE database on road crashes and national sources; Population data is from Eurostat
The 2023 figures are based on preliminary data for most countries and are subject to changes when the final data are released in autumn 2024. Estimates for 2023 cover the whole year and all roads and refer to deaths within 30 days but for the following countries they are based on partial data: Spain (rural roads), Netherlands (partial data; also, police-registered fatalities are under-reported by around 10-15%), Portugal (fatalities within 24 hours), Switzerland (6 months). There were no road deaths in Liechtenstein in 2023.
Data for 2023 is compared with three time-periods: 2022 (the previous year), 2019 (the baseline year for the target of 50% fewer deaths by 2030) and the average of 2017-19 (to take account of fluctuations in small countries). In Bulgaria, the absolute number of fatalities fell between 2022 and 2023 but the population fell at a faster rate leading to an increase in the fatality rate. The percentage changes in the table are based on the absolute number of fatalities, not the rate per million population
Details
- Publication date
- 8 March 2024
- Author
- Directorate-General for Mobility and Transport


