The 20,640 deaths on EU roads last year represented a 4% increase in relation to 2021, as traffic levels recovered after the pandemic.
While the underlying long-term trend is downward (-9% compared to pre-pandemic year), it is not decreasing at a fast enough pace to reach the EU target of halving the number of deaths by 2030. Furthermore, progress continues to be very uneven between Member States. Lithuania and Poland reported the largest decreases, of more than 30%, between 2019 and 2022, although the fatality rate in Poland still remains above the EU average. By contrast, over the last three years, the number of road deaths in Ireland, Spain, France, Italy, the Netherlands, Slovakia and Sweden has remained stable or has risen.
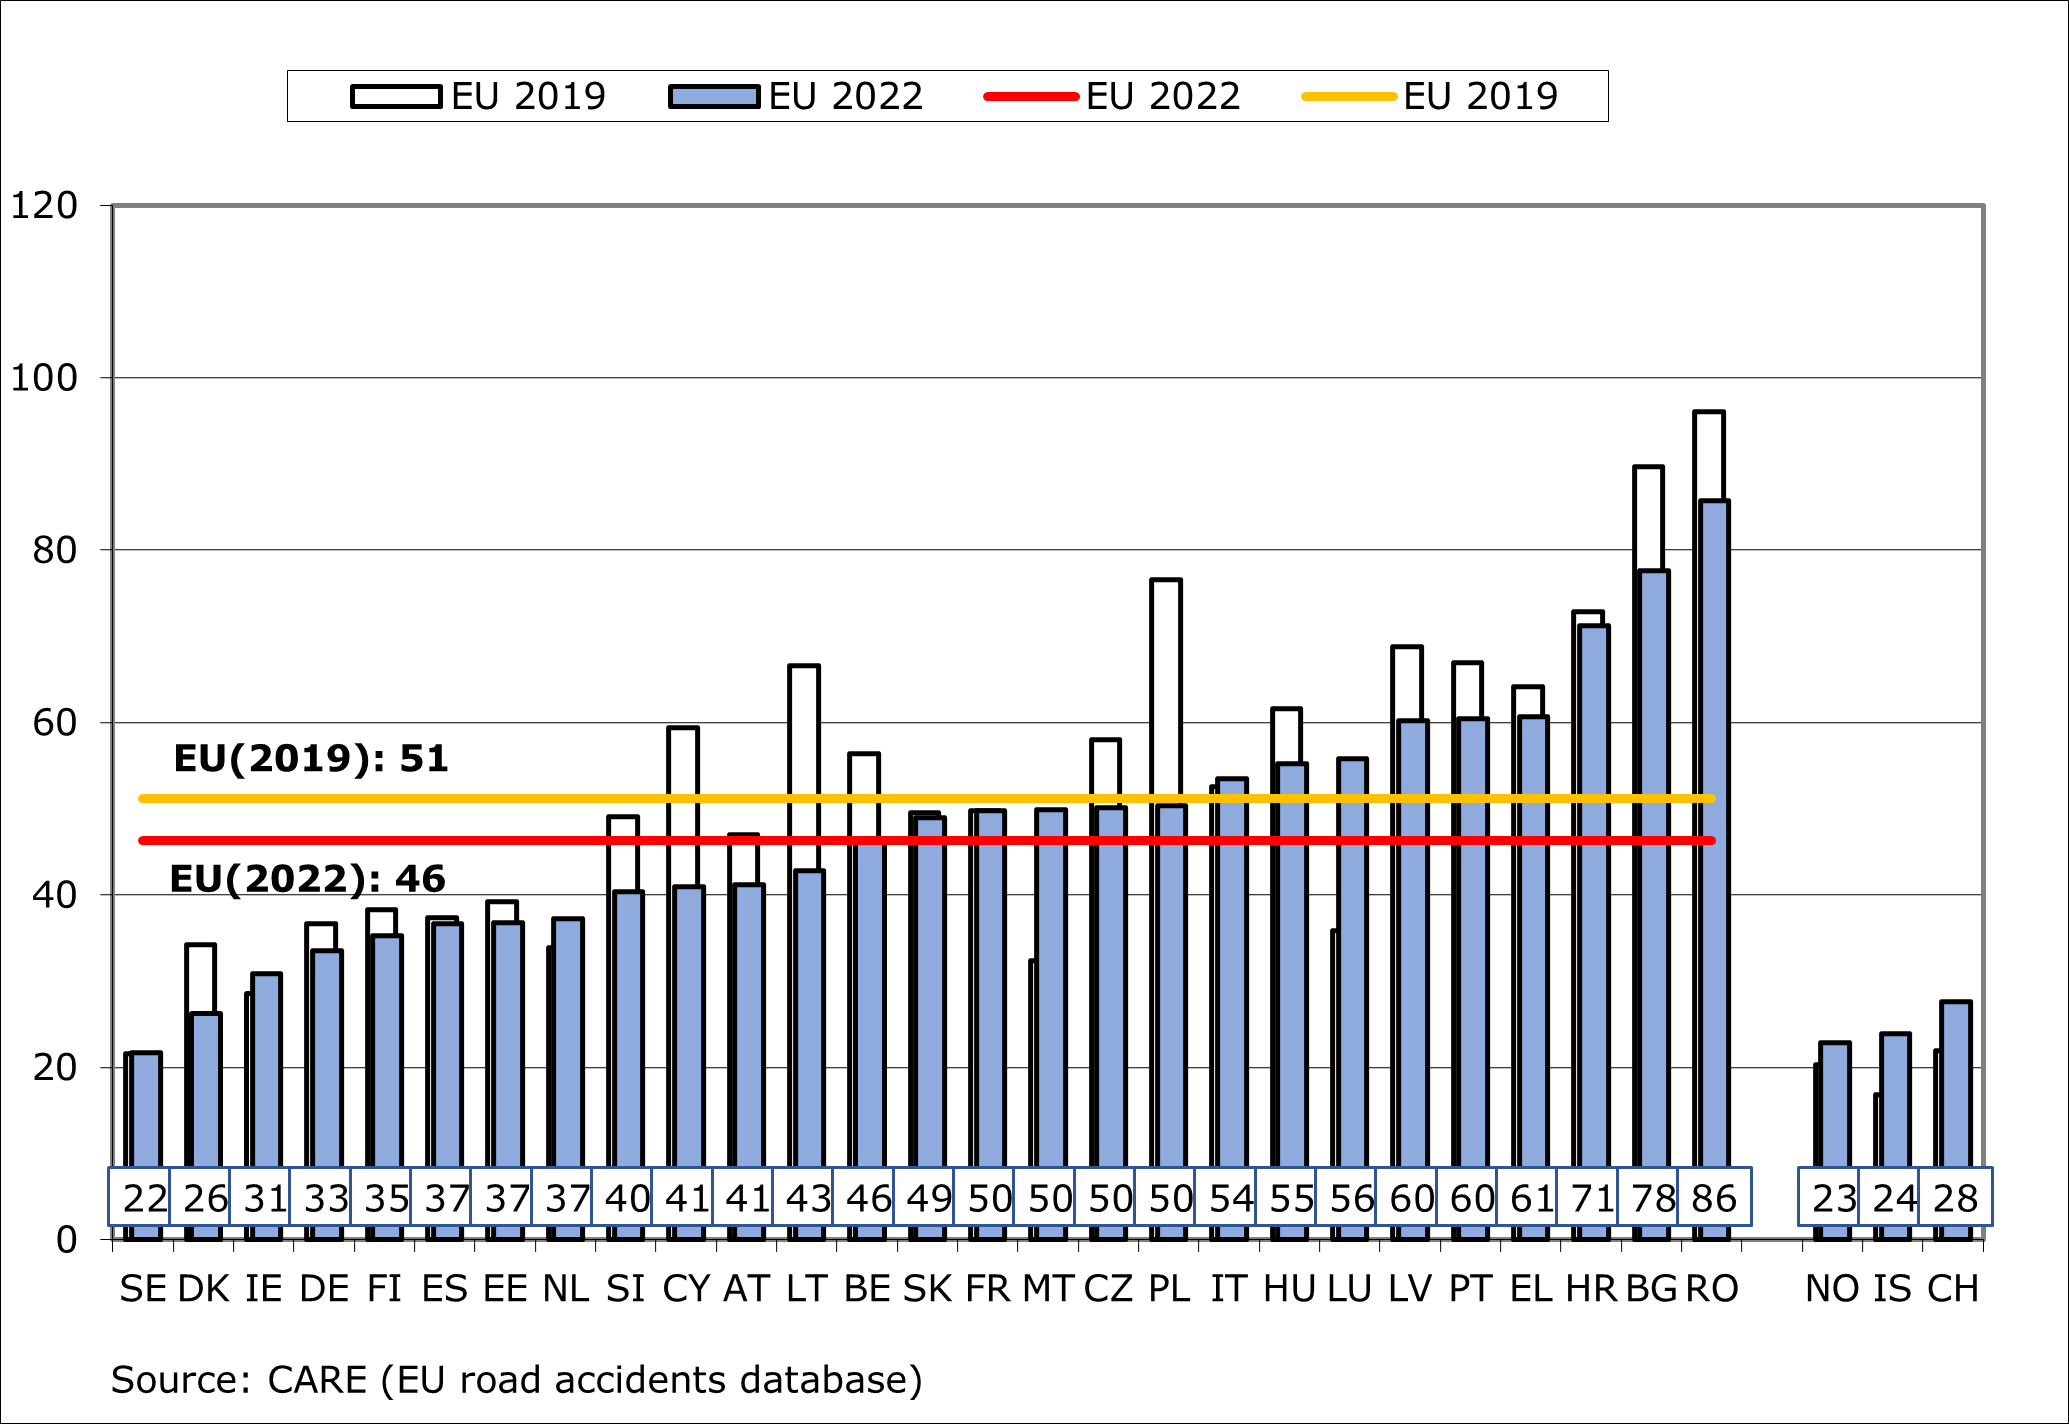
The overall ranking of countries’ fatality rates has not changed significantly since prior to the pandemic with the safest roads in Sweden (22 deaths per one million inhabitants) and Denmark (26/million) while Romania (86/million) and Bulgaria (78/million) reported the highest fatality rates in 2022. The EU average was 46 road deaths per million inhabitants in 2022.
The figures published by the European Commission today reveal the final numbers of road fatalities for 2022, following the publication of preliminary data in February 2023.
Estimates for 2023
Preliminary figures for the first six months of 2023 indicate the number of deaths on EU roads has fallen slightly, compared with the same period in 2022. Some Member States, including Belgium, France, Slovakia and Finland, have recorded notable falls. Other countries, such as Latvia, Lithuania, Portugal and Sweden have seen significant increases to date. Monthly fluctuations make an accurate prediction for the entire year difficult.
Latest number of road fatalities in the EU and EFTA countries
| 2022 data | 2023 data (first six months) | |||||
| Absolute number | Rate per million population | % change in absolute number in 2022 in relation to: | Trend in relation to same period in: | |||
| 2022 | 2022 | 2021 | 2019 | Average 2017-19 | 2022 | |
| EU-27 | 20 640 | 46 | 4% | -9% | -11% | - |
| Belgium | 540 | 46 | 5% | -16% | -13% | ↓↓ |
| Bulgaria | 531 | 78 | -5% | -15% | -17% | - |
| Czechia | 527 | 50 | -1% | -15% | -15% | - |
| Denmark | 154 | 26 | 18% | -23% | -15% | - |
| Germany | 2 788 | 33 | 9% | -8% | -12% | - |
| Estonia | 49 | 37 | -11% | -6% | -12% | ↑ |
| Ireland | 155 | 31 | 14% | 11% | 9% | ↑ |
| Greece | 635 | 61 | 2% | -8% | -10% | - |
| Spain | 1 746 | 37 | 14% | -1% | -3% | - |
| France | 3 267 | 50 | 11% | 1% | -1% | ↓↓ |
| Croatia | 275 | 71 | -6% | -7% | -13% | ↓↓ |
| Italy | 3 159 | 54 | 10% | 0% | -4% | - |
| Cyprus | 37 | 41 | -18% | -29% | -28% | ↓↓ |
| Latvia | 113 | 60 | -23% | -14% | -19% | ↑↑ |
| Lithuania | 120 | 43 | -19% | -35% | -35% | ↑↑ |
| Luxembourg | 36 | 56 | 50% | 64% | 30% | - |
| Hungary | 537 | 55 | -1% | -11% | -13% | ↓ |
| Malta | 26 | 50 | 189% | 63% | 47% | ↓↓ |
| Netherlands | 655 | 37 | 29% | 12% | 14% | ↓ |
| Austria | 370 | 41 | 2% | -11% | -10% | ↓ |
| Poland | 1 896 | 50 | -16% | -35% | -34% | ↓ |
| Portugal | 618 | 60 | 10% | -10% | -7% | ↑↑ |
| Romania | 1 633 | 86 | -8% | -12% | -14% | ↓ |
| Slovenia | 85 | 40 | -25% | -17% | -14% | ↓↓ |
| Slovakia | 266 | 49 | 8% | -1% | -1% | ↓↓ |
| Finland | 196 | 35 | -13% | -7% | -15% | ↓↓ |
| Sweden | 227 | 22 | 8% | 3% | -15% | ↑↑ |
| Switzerland | 241 | 28 | 21% | 29% | 11% | ↓↓ |
| Norway | 124 | 23 | 55% | 15% | 16% | ↓↓ |
| Iceland | 9 | 24 | 0% | 50% | -33% | ↓↓ |
Source: CARE (Community Road Accident) database. Figures are generally those as reported by police. Several countries have a significant degree of international traffic which impacts on the number of fatalities in the country. The percentage changes in the table are based on the absolute number of fatalities, not the rate per million inhabitants. Population data are from Eurostat.
Notes: 2022 data are provisional for Ireland and Greece. For the Netherlands, the number of fatalities registered by the police is under-reported and equates to around 85-90% of the total number published nationally. In 2022, the overall total was 745. For Portugal, 2017 data does not include two NUTS regions (Azores and Madeira), which impacts slightly on the percentage change from 2017-2019. In Liechtenstein, there were 2 fatalities in 2022.
|
Legend for final column: |
|
|
- |
largely unchanged (+-5%) |
|
↓ |
down, to a degree (>5-10%) |
|
↓↓ |
down significantly (>10%) |
|
↑ |
up, to a degree (>5-10%) |
|
↑↑ |
up significantly (>10%) |
|
n/a |
data not available |
Road fatalities per million population, 2019-2022
Details
- Publication date
- 19 October 2023
- Author
- Directorate-General for Mobility and Transport